Forex Zone - Forex Forum

Fibonacci SR Indicator

Discussion started on MT4 / MT5 Indicators

Administrator
  • Hero Member
  • Posts: 5121
  • Points: 29375
  • Likes Received: 5123
  • Reputation: +220/-14
The Fibonacci SR Indicator creates support and resistance lines. This indicator is based on Fibonacci Retracement and Extension levels. It will consider many combinations of the Fibonacci levels and draw support/resistance lines based on these. This indicator uses tops and bottoms drawn by the ZigZag indicator in its calculations. The ZigZag can also be drawn on the chart, if necessary.

The indicator considers many combinations of past reversal points and Fibonacci ratio levels, and when it sees confluence of multiple lines at the same price, then this becomes a support/resistance line drawn by the indicator. A future market reversal will often occur exactly at these lines. This is an automatic indicator. So, old lines will be deleted and new lines will be drawn as the market advances.


This indicator is FREE with no restrictions. It will work on any MT4 platform.

Note: DLL imports must be enabled for this indicator to work.

Here is complete information about the Fibonacci SR Indicator.

Source Code Available: If you would like the source code of this to make your own modifications or for other reasons, please email support@mql-programming.com for the fee.

EXAMPLE:
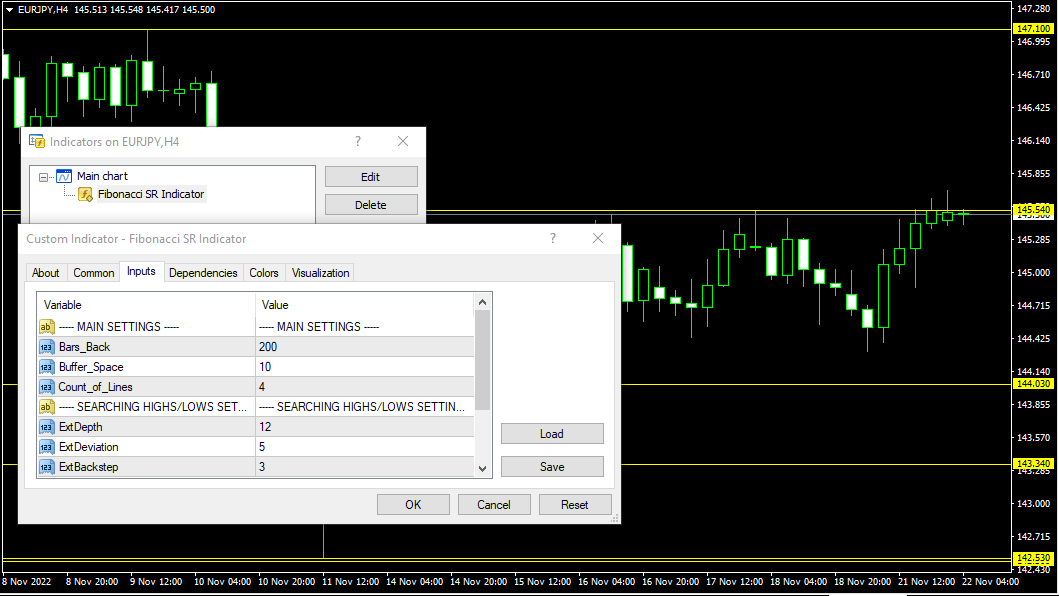
Fibonacci SR Indicator in MT4 / MT5 Indicators_topic=49


Feel free to post your comments, questions, concerns, and bug reports in this forum section.


Linkback: https://www.forex.zone/mt4-mt5-indicators/8/fibonacci-sr-indicator/49/
#1 - June 13, 2018, 12:23:55 AM
Attachments:
« Last Edit: October 27, 2024, 11:51:03 PM by Admin »

Fibonacci SR Indicator in MT4 / MT5 Indicators_topic=585

Administrator
  • Hero Member
  • Posts: 5121
  • Points: 29375
  • Likes Received: 5123
  • Reputation: +220/-14
Do you have any opinion on whether it is better to use Fibonacci  or trendlines to find support and resistance levels ?
I think both methods are powerful. I do not think one is better than the other.
#2 - January 15, 2019, 12:02:44 AM

  • Hero Member
  • Posts: 1215
  • Points: 0
  • Likes Received: 566
  • Reputation: +15/-3
Do you have any opinion on whether it is better to use Fibonacci  or trendlines to find support and resistance levels ?
I think both methods are powerful. I do not think one is better than the other.
I think all indicators are good sir, just from the understanding of the different from one trader to another trader?
#3 - January 26, 2019, 05:52:51 PM

  • Full Member
  • Posts: 153
  • Points: 611
  • Likes Received: 58
  • Reputation: +3/-1
this indicator can also be a material consideration for determining open positions
#4 - February 03, 2019, 08:47:49 PM

  • Hero Member
  • Posts: 2224
  • Points: 7991
  • Likes Received: 140
  • Reputation: +6/-1
Fibonacci maybe not included as an indicator, if we look on list indicator, hence we will can`t finding Fibonacci on the list, maybe this is included as a list object, and just need to click insert on our platform then we can finding Fibonacci and choose what will be attached, Fibonacci retracement or expansion

This tool still used many traders to determine support and resistance with use level fibo as a trigger
#5 - February 04, 2019, 01:40:50 PM

  • Jr. Member
  • Posts: 95
  • Points: -5
  • Likes Received: 16
  • Reputation: +0/-0
Fibonacci is currently the most popular indicator even this indicator can make a trader determine the direction of the market well, this indicator is very good if it is combined with a pivot point indicator for maximum results
#6 - February 04, 2019, 06:57:12 PM

  • Jr. Member
  • Posts: 88
  • Points: -94
  • Likes Received: 24
  • Reputation: +2/-0
very good analysis and can be a consideration in trading


#7 - February 04, 2019, 07:43:04 PM
« Last Edit: February 04, 2019, 07:44:23 PM by Admin »

  • Hero Member
  • Posts: 2224
  • Points: 7991
  • Likes Received: 140
  • Reputation: +6/-1
Fibonacci is currently the most popular indicator even this indicator can make a trader determine the direction of the market well, this indicator is very good if it is combined with a pivot point indicator for maximum results
Some trader they combine Fibonacci with another indicator as a filter, like as with RSI and stochastic, this indicator can use to determine overbought and oversold area, and look on level fibo to determine support and resistance, if already having a good experience, this tool very valuable 
#8 - February 05, 2019, 06:12:46 AM

  • Jr. Member
  • Posts: 91
  • Points: 0
  • Likes Received: 13
  • Reputation: +0/-0
Good morning sir, indeed the fibonaci indicator is a special taste for traders, especially when combined with zigzags and others, of course, will make it more special.
#9 - February 06, 2019, 03:06:11 AM

  • Sr. Member
  • Posts: 424
  • Points: 18
  • Likes Received: 39
  • Reputation: +0/-0
Good morning sir, indeed the fibonaci indicator is a special taste for traders, especially when combined with zigzags and others, of course, will make it more special.
in theory it is, this indicator includes tools that many people use, but in determining entry sometimes it will be different for each person
#10 - February 24, 2019, 02:06:31 AM

  • Full Member
  • Posts: 104
  • Points: 0
  • Likes Received: 4
  • Reputation: +0/-0
The Fibonacci SR Indicator creates support and resistance lines. This indicator is based on Fibonacci Retracement and Extension levels. It will consider many combinations of the Fibonacci levels and draw support/resistance lines based on these. This indicator uses tops and bottoms drawn by the ZigZag indicator in its calculations. The ZigZag can also be drawn on the chart, if necessary.


The indicator considers many combinations of past reversal points and Fibonacci ratio levels, and when it sees confluence of multiple lines at the same price, then this becomes a support/resistance line drawn by the indicator. A future market reversal will often occur exactly at these lines. This is an automatic indicator. So, old lines will be deleted and new lines will be drawn as the market advances.


Complete information about the Fibonacci SR Indicator can be found HERE


Feel free to post your comments, questions, concerns, and bug reports in this forum section.
I am now focusing on using Fibonacci and I get additional numbers for fibonaci. Sayang adds these numbers based on the picture that will occur when there is a trend or reversal. and so far I have been greatly helped by this fibo. but the biggest disadvantage of Fibonacci is the news. because direction cannot be predicted
#11 - February 24, 2019, 03:30:04 AM

paidto

I am now focusing on using Fibonacci and I get additional numbers for fibonaci. Sayang adds these numbers based on the picture that will occur when there is a trend or reversal. and so far I have been greatly helped by this fibo. but the biggest disadvantage of Fibonacci is the news. because direction cannot be predicted
if every day using the tools that are always the same, it will be easier to know the weaknesses of the tool, in this case you say a weakness when there is a news release, if in my opinion if there is a news release you should not enter first, but just wait
#12 - February 27, 2019, 01:57:07 AM

  • Starter
  • Posts: 9
  • Points: 0
  • Likes Received: 1
  • Reputation: +0/-0
Do you have a trial demo for this one?
#13 - March 10, 2019, 11:53:51 PM

Administrator
  • Hero Member
  • Posts: 5121
  • Points: 29375
  • Likes Received: 5123
  • Reputation: +220/-14
Do you have a trial demo for this one?
There is no trial version available at this time.
#14 - March 11, 2019, 01:40:49 AM

  • Newbie
  • Posts: 19
  • Points: 0
  • Likes Received: 1
  • Reputation: +0/-1
both methods are equally good.
#15 - March 11, 2019, 03:17:18 AM

Members:

0 Members and 2 Guests are viewing this topic.